Density, distribution function, quantile function and random generation for mixture of distributions
dmixtdistr(x, phi, arg, log = FALSE, lower.tail = TRUE)

pmixtdistr(q, phi, arg, lower.tail = TRUE, log = FALSE)

qmixtdistr(
  p,
  interval = c(0, 1000),
  phi,
  arg,
  lower.tail = TRUE,
  log = FALSE,
  tol = 1e-10,
  ...
)

rmixtdistr(n, phi, arg)
Arguments
- x,
q vector of quantiles. If 'x' or 'q' are matrices, then the function will operate on the matrix by row.
- phi
Numerical vector with mixture proportions, where \(sum(phi) = 1\).
- arg
A list of named vectors with the corresponding named distribution parameters values. The names of the vector of parameters and the parameter names must correspond to defined functions. For example, if one of the involved distributions is the gamma density (see
GammaDist), then the corresponding vector of parameters must be gamma = c(shape = 'some value', scale = 'some value'). See examples for more details.- log, log.p
logical; if TRUE, probabilities p are given as log(p).
- lower.tail
logical; if TRUE (default), probabilities are \(P[X <= x]\), otherwise, \(P[X > x]\).
- p
vector of probabilities.
- n
number of observations. If length(n) > 1, the length is taken to be the number required.
See also
fitMixDist, mcgoftest
(for goodness-of fit), and for additional examples:
https://genomaths.com/stats/sampling-from-a-mixture-of-distributions/
Examples
set.seed(123) # set a seed for random generation
# A mixture of three distributions
phi <- c(5 / 10, 3 / 10, 2 / 10) # Mixture proportions

# Named vector of the corresponding distribution function parameters
# must be provided
args <- list(
    gamma = c(shape = 20, scale = 1 / 10),
    weibull = c(shape = 4, scale = 0.8),
    lnorm = c(meanlog = 1.2, sdlog = 0.08)
)

#  Sampling from the specified mixture distribution
x <- rmixtdistr(n = 1e5, phi = phi, arg = args)

# The graphics for the simulated dataset and the corresponding theoretical
# mixture distribution
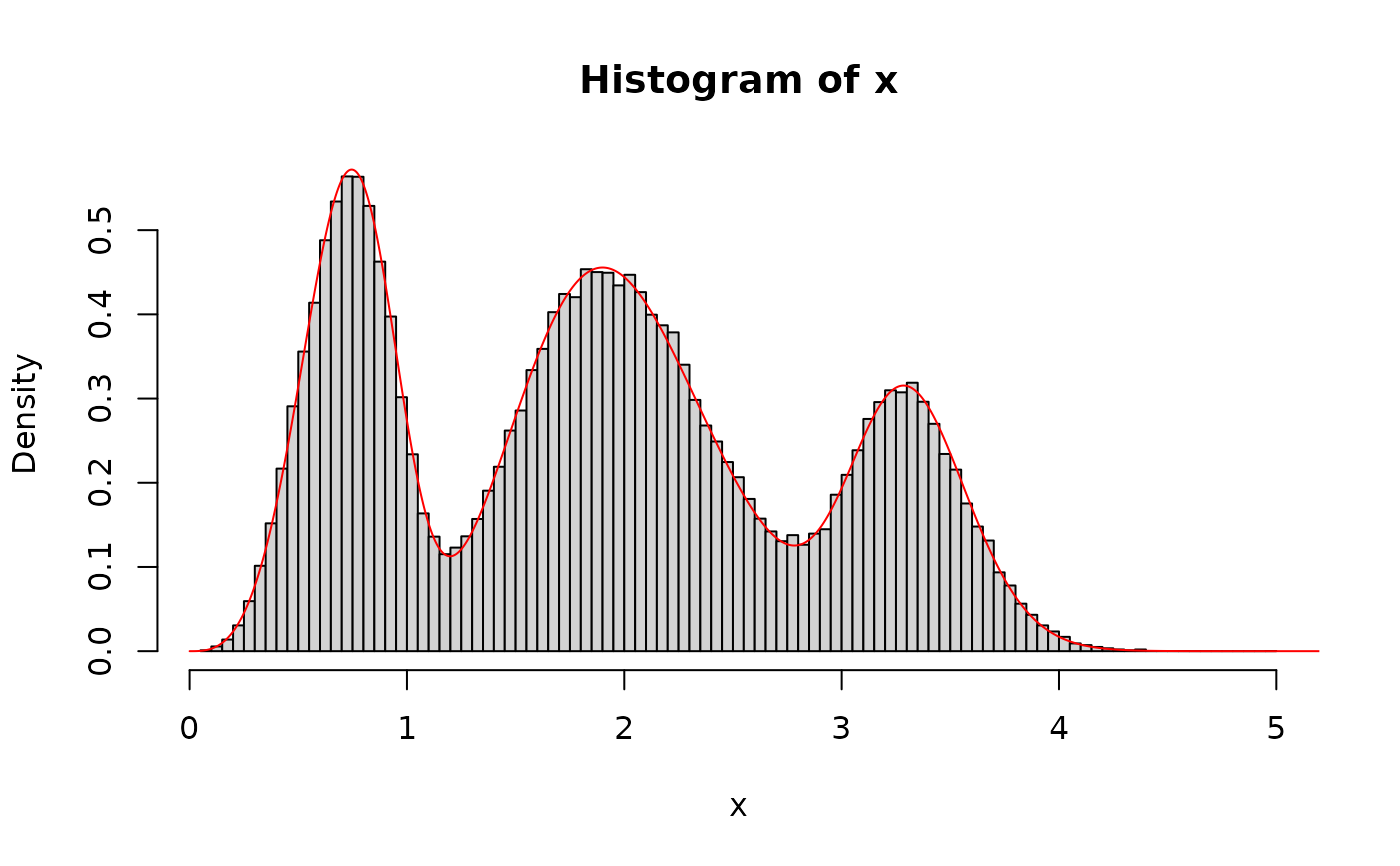
hist(x, 100, freq = FALSE)
x1 <- seq(0, 10, by = 0.001)
lines(x1, dmixtdistr(x1, phi = phi, arg = args), col = "red")
